In order to track our progress each year, I try to quantify the harvest as best I can. I keep a written journal of most of the important activities and progress in the garden, and the journal includes a penciled-in log of any harvests that happen during each week of the season. When I have the chance, I copy that handwritten data into a little spreadsheet I made which handles some of the calculations I’m interested in and updates the totals automatically for me. This spreadsheet is designed specifically for small gardens, not farms, and possibly not even for very large gardens. It’s targeted for situations where you harvest small amounts and can keep track of harvested items as single units (for most things) or small bunches (for herbs), rather than as large bulk amounts such as bushels.
The concept behind this spreadsheet is that once you add in some typical values at the start of the season for the weight of a given variety when harvested (like the average weight of one cherry tomato), the spreadsheet does all the rest of the calculations as you add to your counts each week. It does its math based on counts, so that you don’t have to keep weighing each time you harvest, just tally how many single items you harvested that week.
Here is a PDF version of our 2015 harvest spreadsheet:
Harvest Spreadsheet PDF
I’ll post a link to a working .xlsx spreadsheet at the end of this post, which is free for you to use and tweak as you see fit.
Here’s how it works:
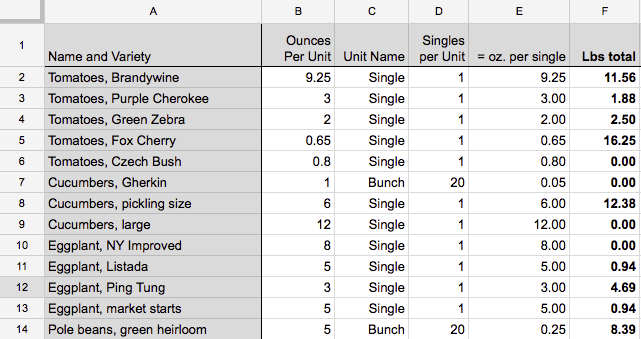
Column A: (Name and Variety)
B (Ounces per Unit): A unit might be a Single (for things like tomatoes or cucumbers), or a Bunch (for things like greens or herbs), or I could call one a Dozen, which would work for some varieties.
C (Unit Name): Name of the Unit referred to in B.
D (Singles per Unit): How many single items are there in a Unit? This is arbitrary and up to you. For example, 20 in a Bunch or 12 in a dozen. I have 10 leaves of Kale equals one Bunch, for example. This is only for determining the average weight of a single leaf, bean, etc so that further math can be done later.
E (Calculated ounces per single): This assists in the next calculation. This is the weight of one tomato, or pepper, or eggplant, or bunch of basil or kale, etc. I can just weigh a total harvest of say 20 beans, and let the spreadsheet calculate the very small weight of one bean—probably too small for my scale to measure accurately. Then when I harvest, I can count the singles, for example 127 beans in a given week, and the spreadsheet does the rest of the multiplication.
F: Lbs (pounds) total. This is the calculated sum of all of the harvested single items in the row (F), times the calculated ounces per single (E), divided by 16 (ounces per pound) to convert to pounds from ounces. So the value is the total pounds of harvest for this variety all season. At the bottom of Column F is the grand total weight of the season’s harvest across the board.
G (Count Total): Here, the total count of singles for the season for that variety is calculated. For example, total number of tomatoes picked all season, or total number of leaves of kale picked.
I’ve added some additional columns as well.
H (Market Price per lb): This is the price I see at the local farmer’s market for a similar item, so it is what I would have paid per pound if we had purchased it rather than grown it ourselves.
I (Harvest Value): This is the calculated value of the equivalent amount of produce if our own season’s harvest was purchased at the market. For example, Our twenty Brandywines added up to 11.56 lbs, so at the local price of $4/lb we grew the equivalent of $46.25 worth of them.
J (Designated Space): This is a rough idea of how much total space this variety took up in the garden. For example, we had two Fox Cherry plants which each took up about two square feet of soil, so I have them taking up a total of eight square feet. The bottom of this column should add up to the total amount of soil I have available to plant, in our case roughly 220 sq ft.
K (Productivity): This is a calculation of the Harvest Value (I) dividied by the Designated Space (J), and shows the relative value of using garden space for growing one crop versus another, in pure dollar terms. So I can see that using a square foot of soil to grow Brandywines ($7.71 per sq ft) is more than twice as valuable than using the same square foot to grow Pickling Cucumbers
($3.09 per sq ft). I can also see that herbs are the most productive crop in dollar per square foot terms. This makes sense, as shoppers pay a proportionally large amount for the tiny bunches of herbs that they need for cooking. A bunch of kale might weigh half a pound and cost $3, but a home cook would never buy a pound of sage; they might pay $3 for half an ounce. This is why most of the herbs show very high equivalent market prices per pound.
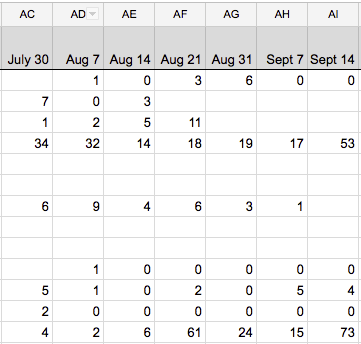
Further over to the right, we see the actual harvest data, divided up by week. These are always singles, as in three individual tomatoes or 73 individual beans or 12 individual leaves of collards. Each date marks the last day of that week, so the value in the Aug 21 entry would be the total of that variety harvested from the week ending on the 21st. This means that the last ‘week’ of each month might be ten or eleven days—each month has three 7-day weeks followed by one long week in order to bring us to the end of the month without extra days.
So in summary, to use the spreadsheet:
- Enter the names of your varieties in Column A.
- Determine the average weight per unit using a scale. For example, weigh 5 cucumbers together and divide the total weight by 5. Or weigh 10 leaves of kale, call that a Bunch, enter 10 in column D, and the spreadsheet will figure out the single leaf weight. At this point you really won’t need your scale again.
- Optionally enter your own figures for H, I and J if these calculations are of interest to you regarding dollar values and productivity.
- At the end of each week of the season, enter your total counts. Again, it’s a single count for a tomato, or a single count for a leaf of greens. If I picked 25 leaves of kale on a single day and no more kale for the week, I put ’25’ as the value for that week. Two tomatoes on the first day of the week and two more on the last day of the week? The value for that week would be ‘4’.
- Let the spreadsheet calculate the rest!
Using this method, after the initial setup of the first few columns, I simply tally up my counts for the week and enter them. The rest is done for me.
The spreadsheet tells me, for example:
— We harvested about 87.44 lbs of produce this year—similar to last year.
— We harvested the equivalent of about $458.23 worth of produce.
— The award for the longest growing season goes to… Chives! April – December.
— Chives also brought in the best value per square foot, at $43.75/sq ft.
This is due to their high equivalent market price, multiplied by their long season.
— Our average value of harvested produce per sq ft of soil is $2.06.
— 1333 hops cones, totaling 1.88 pounds… all given to local homebrewers.
— Each square foot of soil used for Cherry tomatoes proves to be slightly more productive in dollar terms ($8.13) than if it were used for Brandywines ($7.71).
Here is a link to the same spreadsheet, ready for you to customize. I hope you find it useful.